Your Cart is Empty
FLY REELS

Fly Lines

GEAR

Shop By Fish


Fishing for Data
Decisions on our fishing regulations are complex.
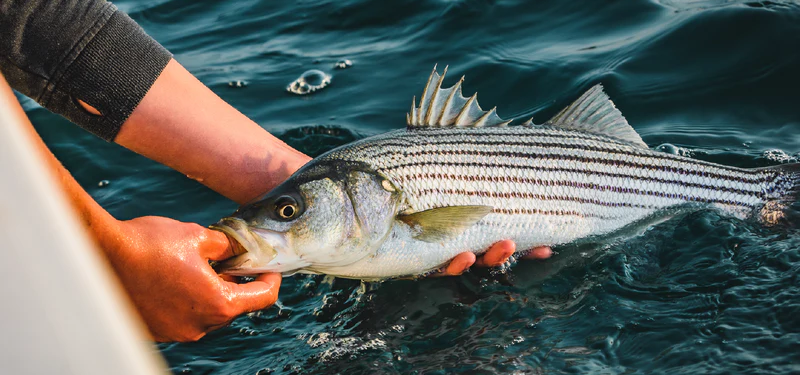
When do seasons open? What areas can we fish? How many can commercial or recreational fisherman keep to eventually find their way to our plates? With striped bass numbers just being reported, to understand how these studies actually get their data we asked an expert. Although Ross Kessler does not study striped bass, he’s doing the hard work out on the water making sure there is good data to help inform decision makers about our fisheries. His two trips annually, circling Cape Cod on the Gloria Michelle, are long, grueling hours of capturing and cataloging fish, Ross is also an avid angler, so we think he brings a unique perspective to the science. Enjoy!
-Team Cheeky
Fishing for Data
By Ross Kessler
I’ve gotten to know the folks at Cheeky over the past few years. In addition to being a member of the Thomas and Thomas Ambassador program, I’m a biologist with the Massachusetts Division of Marine Fisheries. Recently, I was discussing some recent field work with Peter Vandergrift of Cheeky and he asked I share what it is we do on Resource Assessment and why.

For the past 20 or so years, I’ve assisted the DMF with the resource assessment program. The purpose of resource assessment is to provide fisheries management with a sense of how many and what kind of fish are out there. The project in Massachusetts has been active for over forty years. We make trips twice annually in May and September. Many states have their own programs, and the feds have one that covers federal waters, ours is focused on Massachusetts waters. The results of these field activities provide valuable data in assessing recruitment and future stocks of fish.
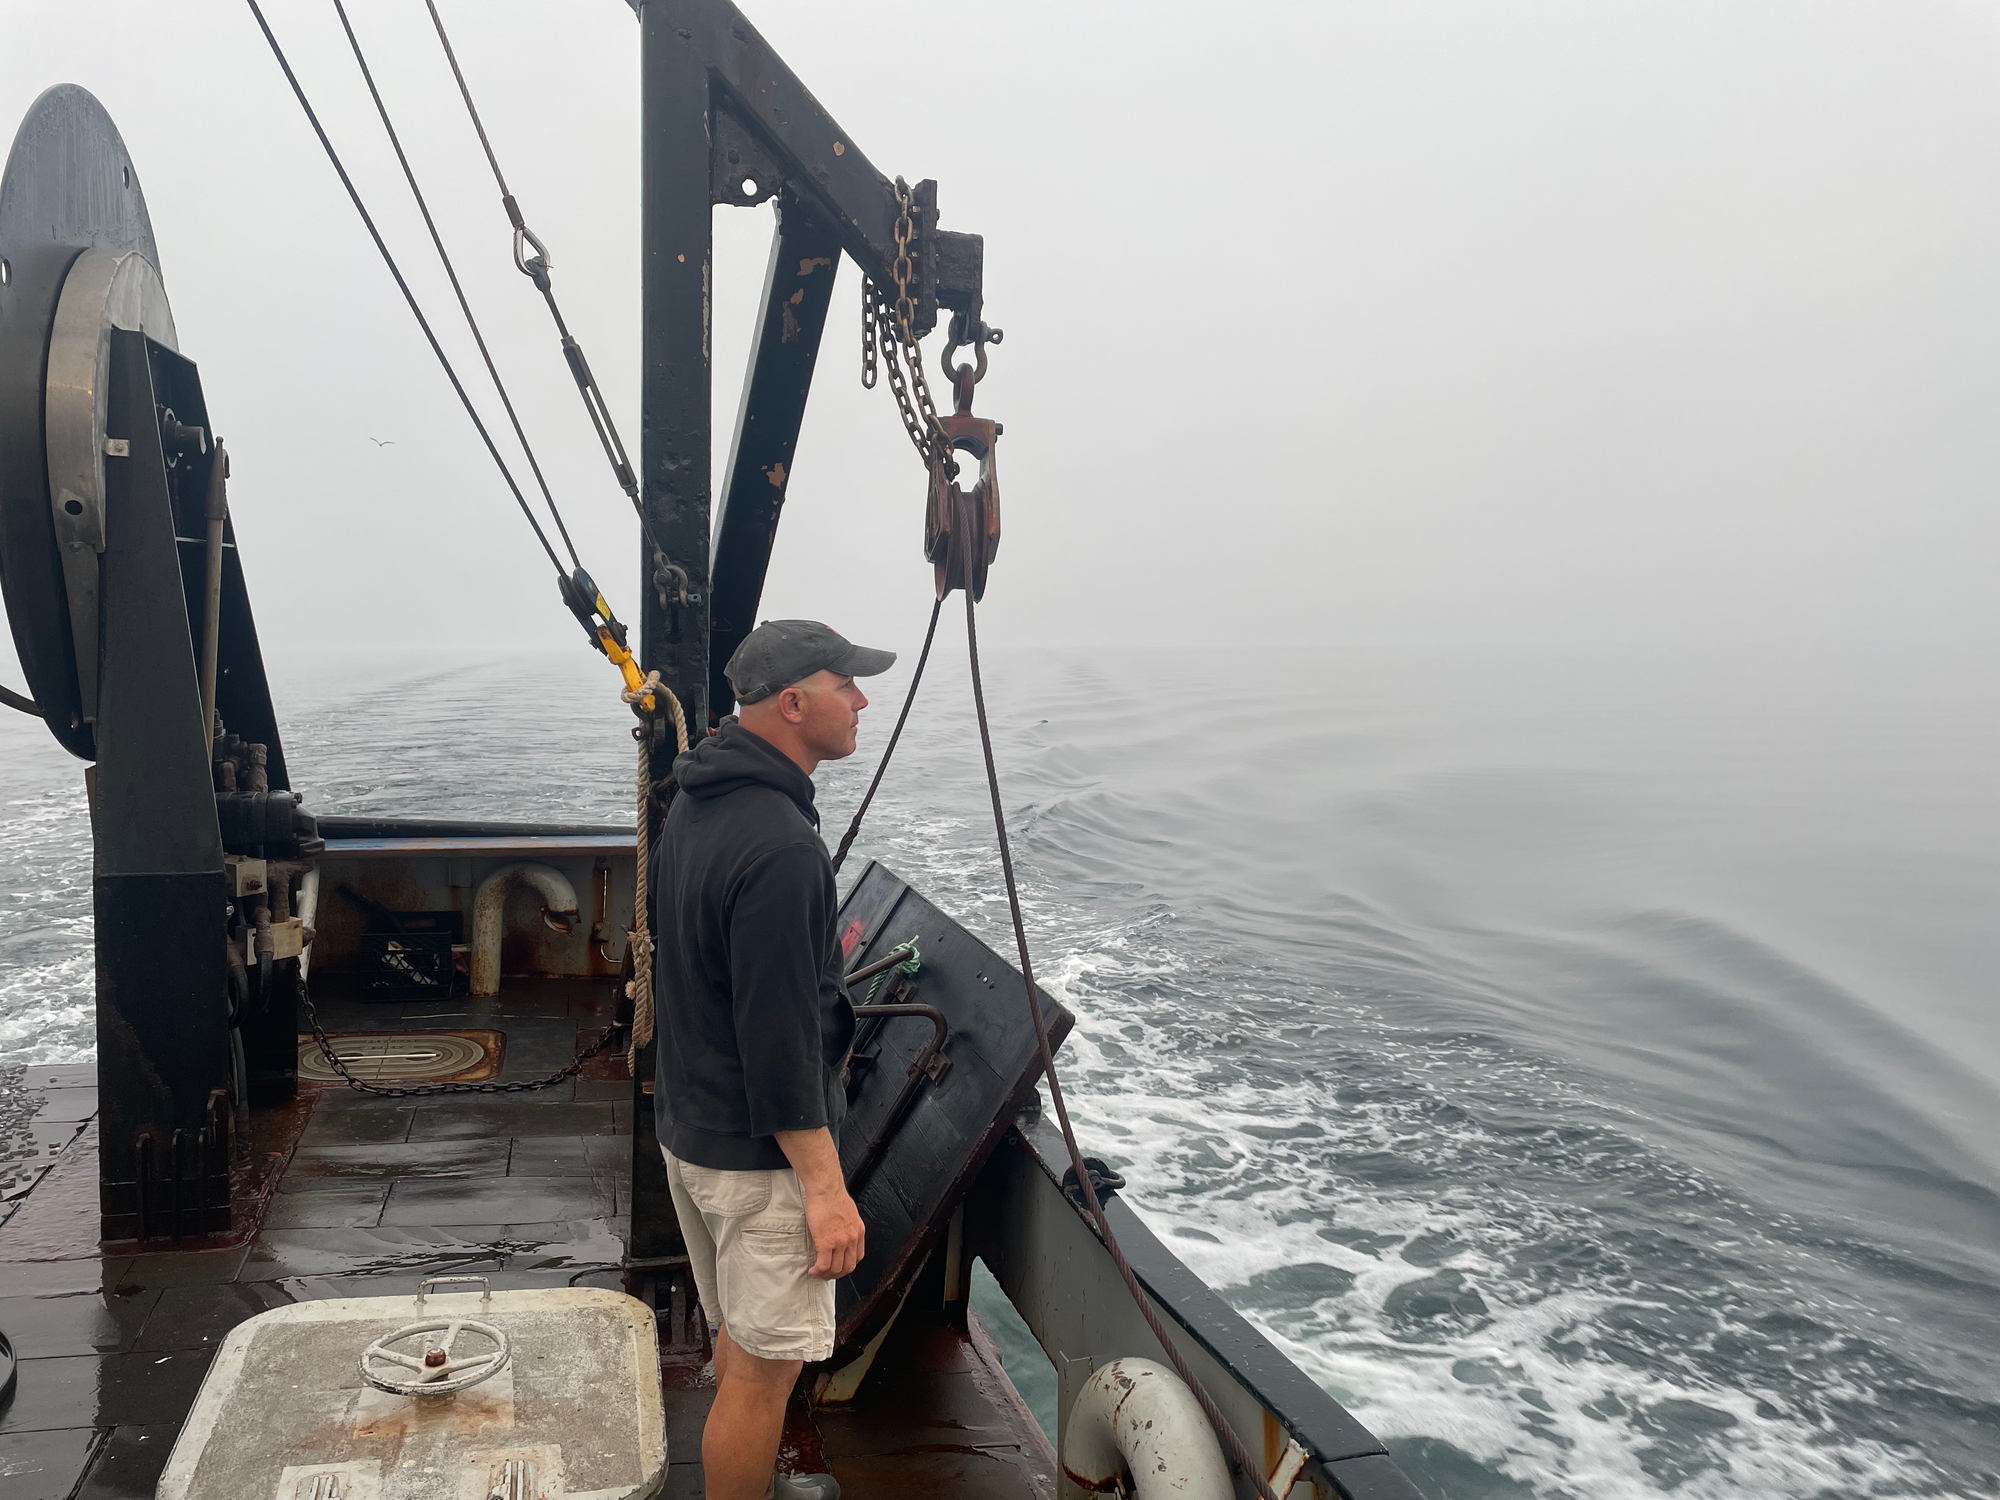
The trips in Massachusetts occur aboard the National Oceanic and Atmospheric Administration (NOAA) Corps maintained Research Vessel, Gloria Michelle, out of Woods Hole, MA. To consistently sample from year to year, the gear that is fished has remained unchanged for 40 years. We use an otter trawl or ‘dragger’. Under normal circumstances a net pulled behind a boat can only open as wide as the width of the vessel. This type of gear, however, utilizes hydrodynamic doors on wires that connect to a net. The doors ‘fly’ wider than the back of the boat which opens the net. The setup is also weighted so that it fishes on the bottom for ‘groundfish’ or demersal species as opposed to pelagics-open ocean migrators. Additionally, when fished the net is only being pulled at 1.5 – 3 knots (nautical miles/hour). There are various arrays of nets that open taller or shorter or have larger rollers for rocky areas. The mesh size and type also vary according to the species that are sought after in the commercial fishing world. The state net uses a variety of mesh sizes throughout, but the back of the net called the ‘cod end’ has a mesh liner that is 1/2 “ and catches very small fish. There is a lot of info on the web if any reader wants to learn more about Otter trawls.

In addition to knowing the gear, scientists need to know where to fish. We have broken the sea up into various strata or location. A strata, can be defined by water body, bottom type, or depth. Each strata receives a certain number of tows. Tow number per strata are based on historical catches, time, and, of course, financial constraint. The catch from each tow is assessed by species, size of each fish, and aging in some species. Tow locations in each strata are determined through the random stratified method. In other words, we are not looking for high concentrations or low concentrations of fish we are sampling various habitats and counting the catch. If the scientists were to intentionally choose areas of high or low fish abundance it would bias the outcome. Sampling through this technique provides a ‘relative abundance index.’ You see, the efficiency of our gear is not truly known. If you remember I mentioned earlier that the gear is mostly unchanged as is the way it is fished. So, the things we know pretty well is the area swept and that the gear fishes at the same efficiency from tow to tow. This method shows trends in fish assemblages by strata. In short, it tells us if there are more or less fish than there were in prior years.

While on deck every day we sort the catch of every tow by species. We then measure the catch and performed age and growth analysis on certain species. Age and growth are calculated by collecting hard parts of fish like scales or ear bones known as otoliths. These hard structures show growth rings similar to aging trees. On our latest trip we collected otoliths from winter flounder, summer flounder, yellowtail flounder, scup, seabass, and haddock. In this ‘leg’ of the trip, we fished Massachusetts waters from Sandwich in the Cape Cod Canal up to Provincetown, down the back side of the Cape, across Nantucket Sound to south of Nantucket, west to South of Martha’s Vineyard, back up through the Muskeget Channel, and finally through Vineyard Sound to Woods Hole. We basically circled Cape Cod.
People always ask about oddities that we catch and we certainly see a few. I’d break down oddities into two categories. First, local fish that typically don’t get caught or shouldn’t live in the strata we are fishing. This fall we caught cornetfish, moonfish, filefish, oyster toadfish, and a hogchoker flounder. The second category are southern species. The southern species are typically only seen in the fall survey and likely populate only the warm water rings that spin off the gulf stream to Massachusetts waters. Some of these that I saw this year included, banded rudderfish, a smooth pufferfish, and an African pompano - which was a first for me.

Being a long-time participant on this project has kept me in touch with many species of fish in our area and given some insight into changes in the fishery. For instance, one year we caught large numbers of young of the year haddock. These very small, one to two-inch fish, grew into a strong year class. You may notice haddock on the menu in many restaurants where Atlantic cod used to be. Codfish, sadly have not made such a presence in quite some time. A little over twenty years ago I was involved with a cod tagging project. We were able to catch hundreds of fish in, literally, a three or four minute tow. I have not seen those aggregations in many years.
Time has changed our assemblages of fish quite remarkably. While writing this piece I read in an older version of Bigelow and Schroeder’s, Fishes of the Gulf of Maine that northern kingfish were very rarely caught in our waters. We see them regularly in our surveys now. Black seabass have become a mainstay in Buzzards Bay where they were merely present many years ago. The population of scup is currently very high. We consistently see many year classes in both the spring and fall surveys. Both seabass and scup are now more present in Cape Cod Bay than they were in my lifetime. Many of these changes are due to our waters becoming warmer, some may be due to fishing pressure over time. I don’t like to ever point at one thing that caused the change, it is likely a number of factors. Being able to bring in consistent data over decades is so important to understanding and managing our fisheries effectively.

The one thing I will say, is that it has been a privilege to be able to witness changes in a piece of our fishery over a relatively long time in a person’s life, albeit very short in biologic times.